-
Solution overview
Develop the technical skills that Fortune 500 enterprises and the public sector want.
-
U.S. Department of State (Cyber Advance for Women in MENA)
Build your skills and launch your career in Cybersecurity.
-
USAID Jordan (Tech for Jobs)
Increase your data analytics capabilities with this free program.
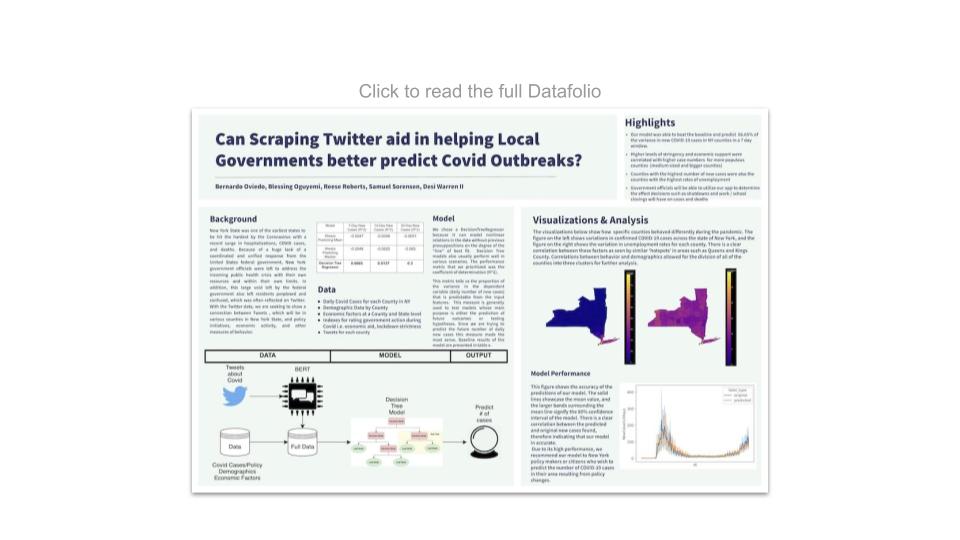
DS4A Capstone Project Spotlight: Can Scraping Twitter Aid in Helping Local Governments Better Predict Covid Outbreaks?
In this blog series, we're proud to shine a light on some of the top Capstone projects from the first graduating class of Data Science for All / Empowerment. Capstone projects are a critical component of the DS4A / Empowerment curriculum in which teams get together to work on projects that solve real-world data challenges faced by today’s leading companies and public sector organizations.
WINNER: BLACKROCK INNOVATION AWARD
This project received the BlackRock Innovation Award for demonstrating innovation in the sourcing of data, modeling of data, problem formulation, or recommended action. Here's what the Judges had to say:
"This project showed a creative use of a real-time dataset leveraged to promote social good. Their project illustrates how social media datasets can be repurposed in a number of interesting, socially impactful ways."
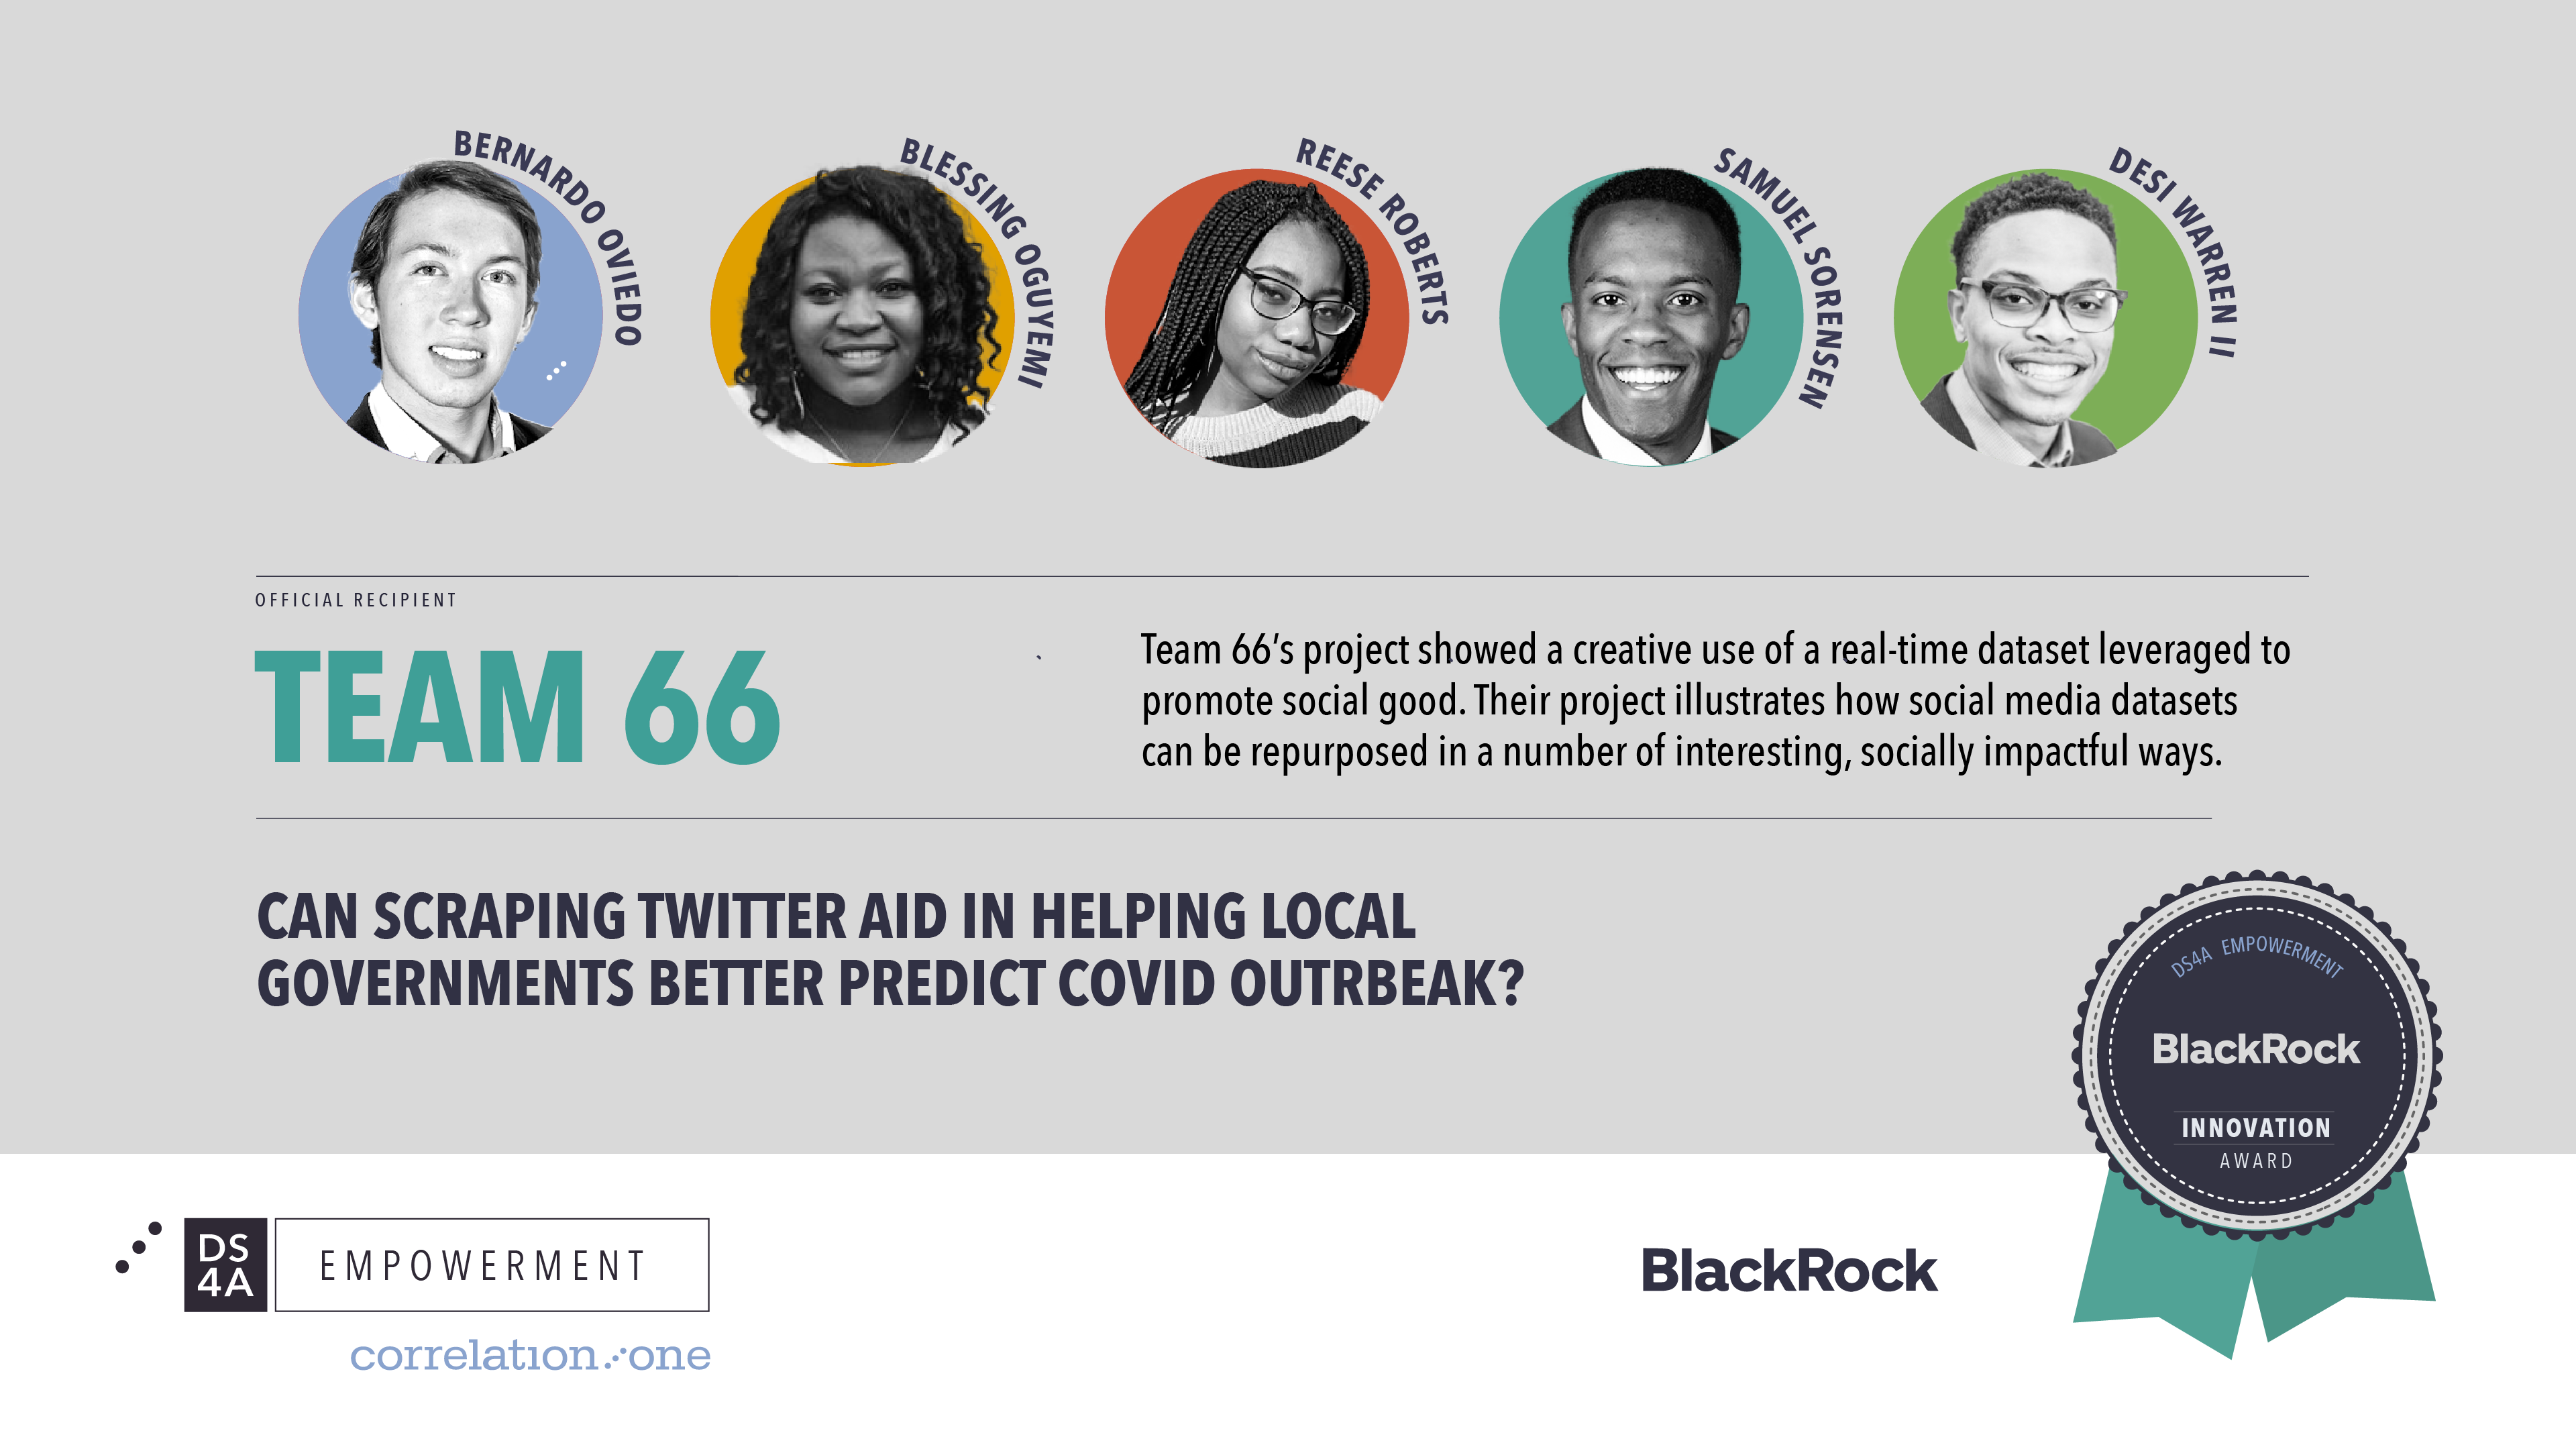
Meet the Team
Bernardo Oviedo
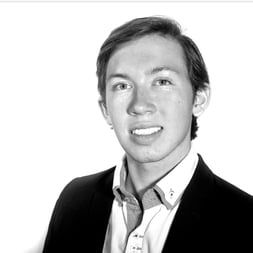
Bernardo Oviedo is a 4th year undergraduate double majoring in Computer Science & Mathematics at the University of Texas at Austin. He chose to join DS4A Empowerment to strengthen his data science skills and to meet smart and passionate individuals. His goals post-program are to complete his degrees with an undergraduate thesis and to enter the software industry or academia.
Reese Roberts
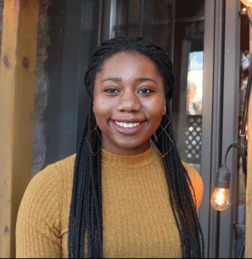 Reese Roberts is a senior at Yale University majoring in Biomedical Engineering. She is passionate about creating innovative technology to make impactful changes in the lives of others. Reese chose to join DS4A Empowerment in order to learn more about the field of data science and gain exposure to coding. After the program, she hopes to begin a career in med-tech and create innovative changes in the field.
Samuel Sorensen
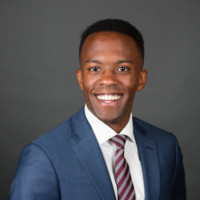 Samuel Sorensen is a recent graduate of Brigham Young University where he majored in Marketing with an emphasis in Marketing Analytics. He chose to join DS4A to build out his coding background and to help him perform better in his current role as an analyst at Goldman Sachs. Post-program Samuel plans to continue improving his data science skills and hopes to land a role in tech as a product manager.
Blessing Ogunyemi
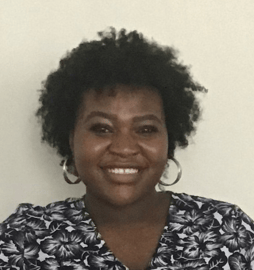
Blessing Ogunyemi is a graduate of Johns Hopkins University where she studied Public Health. She chose to join DS4A Empowerment because she realized that it would be a great opportunity to learn and network with amazing individuals while diving deeper into the world of data science and improving her skills. Her goals post DS4A include learning more about Machine Learning in the health field as well as bias reduction in AI. She is also on a journey to find the perfect intersection where data science, health, and social justice collide.
Desi Warren II
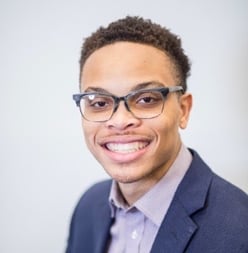
Desi Warren II is a third year undergraduate student majoring in International Affairs with a concentration in Comparative Polticial, Economic, and Social Systems at The George Washington University. He chose to join DS4A to improve his data science skills and join a like-minded community. His goal post-program is to complete his undergraduate degree, travel the world with friends, and continue to work on his data science skills.
About the Project:Can Scraping Twitter Aid in Helping Local Governments Better Predict Covid Outbreaks?
Why did you choose this problem to solve?
We chose this problem because it is very relevant to the current health condition that New York faces. We chose to analyze how covid state wide policies in New York state affect counties differently. We used demographic data, unemployment data, and economic data at the county level and we additionally had policy data at the state level. We also used a non-traditional source of data from tweets at the county level which we gathered using a Twitter scraping tool.
Project Overview
What was the most exciting/surprising findings from your project?
For the Twitter data we had to approximate a centroid and a radius for each county since there is currently no way to query tweets at the county level. Furthermore, we wrote a script to gather the tweets by county from February to November 2020 but initial benchmarks showed that it would take us 9 days to gather the tweets for all the counties. We were thinking of reducing our time range to speed up the collection of tweets but then we had an idea. We came up with the idea of splitting the dates for data collection into three and running three processes simultaneously each gathering the data for a separate slice of time. With this change to the script, our time for data collection was reduced from 9 to 3 days.
What were some challenges you faced and how did you overcome them?
Data collection presented challenges. One was combining the different data
sources (economic data, unemployment rates, demographic & policy data) we had based on date and county into a single dataset. Once we had the data we weren’t sure of the best way to visualize it. We tried making plots by county but the graphs would end up too convoluted (NY state has 62 counties) and detract away from clear, easily identifiable patterns. To fix this issue, we used k-means clustering to group counties based on demographic and economic data. We ended up with 3 clusters (small counties, medium counties, NYC+Long Island) that grouped the counties primarily by population.
Who is your team’s mentor and how did they help?
Our mentors were Peggy Sah, lead ML engineer at athenahealth, and David Rimshnick, Senior Director of Data Science at Aetna Analytics. They helped us focus the scope of our project and to take decisions such as the features we should use for k-means clustering.
What do you view as the impact of your project?
This project can help New York citizens understand the impact that covid had across
the state, and it can help them see how different counties were affected based on economic factors. This project could also be used by government officials to get an idea of how different counties are affected by various levels of covid-related shutdowns. If we had additional time and resources we would try a model that could learn time-based features such as a recurrent neural network (RNN) or a transformer model.
Congratulations to this team, their mentors, and TA, for this accomplishment!

.png?width=207&height=108&name=Mega%20menu%20%E2%80%93%20Featured%20Image%20Template%20(1).png)


